JoeisaRobot JoeisaRobot

Why Choose a Soda Machine for Your Business?

Time:2026-09-29 Author:Aria
0%

Why Choose a Soda Machine for Your Business?

A Soda Machine can turn a small beverage station into a faster, more flexible revenue channel. Grand View Research estimated the global carbonated soft drinks market at approximately US$313 billion in 2023. Its report also forecasts continued growth through 2030. That trend matters for restaurants, cafés, convenience stores, hotels, and entertainment venues. However, market growth alone does not guarantee profit. Location, customer preferences, equipment quality, and operating discipline still decide the result.

Picture a busy lunch period. A customer selects a cold drink, the machine fills a cup within seconds, and staff members remain focused on food orders. A modern Soda Machine can reduce storage pressure because syrup concentrates require less space than finished bottles. It can also support multiple flavors, adjustable portion sizes, and branded drink programs. The National Restaurant Association’s 2024 State of the Restaurant Industry report projected U.S. restaurant and foodservice sales above US$1 trillion. That scale shows strong demand, but it also highlights intense competition for every customer and every margin.

The calculation needs honesty. Equipment costs, CO2 refills, filtration, cleaning, repairs, and electricity can weaken the return. The Centers for Disease Control and Prevention also links frequent sugary drink consumption with health risks, so responsible operators should offer water and lower-sugar choices. I may be too optimistic about convenience. A soda machine succeeds only when hygiene routines, staff training, menu design, and customer demand work together. Used carefully, it can improve service speed, reduce packaging waste, and create a more measurable beverage operation.
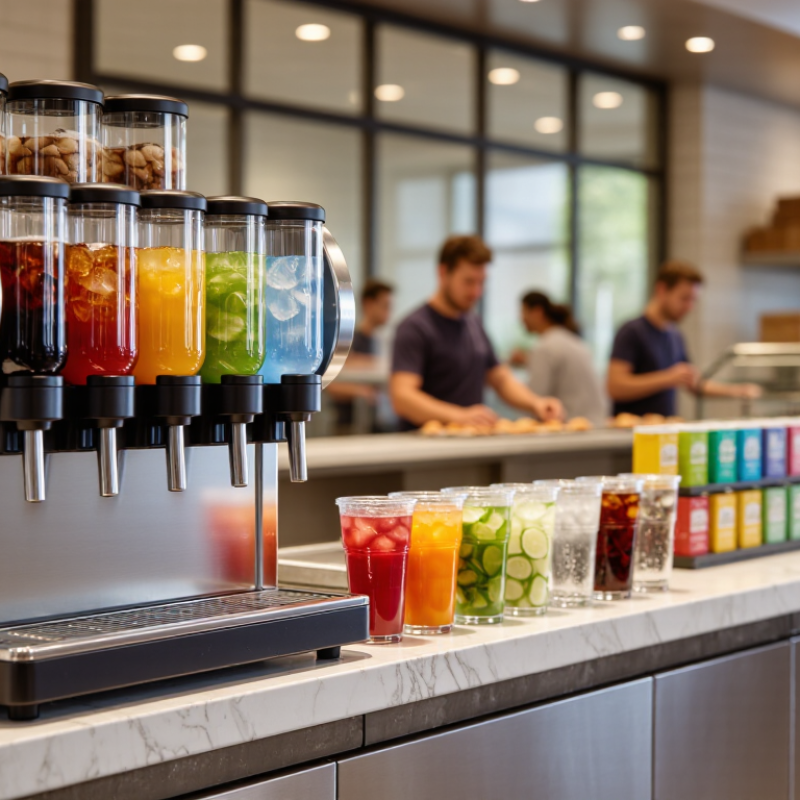
Why Choose a Soda Machine for Your Business?

Define the Business Case: Fountain Soda Can Deliver 60–80% Gross Margins

A soda machine can make a strong business case when drink volume is steady. Fountain beverages often deliver 60–80% gross margins because the liquid cost per serving is relatively low. However, this figure is not net profit. It excludes labor, rent, utilities, equipment payments, maintenance, and payment processing fees.

A practical calculation starts with the full serving cost. Include syrup, carbonated water, ice, cups, lids, straws, and expected waste. A drink sold for $2.50 may have a direct cost near $0.50, creating an 80% gross margin before operating expenses. Small details matter. Oversized ice portions can reduce beverage yield. Poorly calibrated dispensing equipment can quietly increase costs.

I once reviewed a beverage estimate that looked excellent on paper. It ignored cleaning time and occasional product loss. The real margin was lower. That mistake was useful.

Track sales by day, serving size, and location for several weeks before expanding. A busy lunch counter may justify a larger machine, while a low-volume café may not recover the equipment cost quickly.

Keep records. Review them monthly. Prices, supplier terms, and customer demand can change.

A soda machine works best when the margin claim is tested against actual operating data, not treated as a promise.

Measure Drink Costs: Apply the Industry-Standard 5:1 Water-to-Syrup Ratio

Choosing a soda machine can make drink costs easier to track, but only when portions stay controlled. The industry-standard 5:1 ratio means five parts water mixed with one part syrup by volume. It provides a practical baseline for estimating each serving. A 300-milliliter drink needs about 250 milliliters of water and 50 milliliters of syrup before ice and carbonation. Actual output may vary. Water pressure, syrup temperature, nozzle settings, and ice displacement affect the final pour. A ratio chart near the machine helps staff work consistently during busy service. Small errors become expensive over hundreds of cups.

For reliable costing, measure syrup during setup and compare the result with the programmed pour. Check sweetness and taste, but also record syrup usage per shift. A simple daily log can reveal leaks, overfilling, or weak calibration. The 5:1 target should not replace the equipment manual or local operating requirements. Some drinks need a different profile, and customer preferences may change the calculation. Careful judgment matters here. Review the ratio after cleaning, maintenance, or a change in cup size. It is easy to assume the machine is accurate. That assumption can be wrong. A measured test and trained staff improve cost control, while foam, spills, and unsold drinks still require separate waste tracking.

Assess Service Capacity: Compare Dispenser Throughput with Peak-Hour Demand

A soda machine’s advertised output is only a starting point. Real service speed depends on cup size, ice use, drink selection, and how quickly staff can reach the dispenser. A machine may pour rapidly but still create a queue if customers need to move around one another or refill cups during a rush.

Measure demand during your busiest period, not across an average day. For a week, record drink orders in 15-minute intervals around lunch or evening service. Note the largest spike and how many drinks each order typically includes. Then compare that demand with the dispenser’s practical output, allowing time for cup changes, cleaning, and staff movement. Test it during a busy shift. Watch the line.

Leave a little spare capacity for unexpected surges, but avoid buying far more machine than your team can maintain. Check whether the unit can serve several drinks at once, and ask how performance changes when ice or syrup needs replenishing. A short trial can reveal bottlenecks that a specification sheet misses. I would not treat one unusually busy day as the whole story; repeat the count, and question your assumptions. A cramped counter can slow service even when the dispenser itself is fast.

Why Choose a Soda Machine for Your Business?

Assess service capacity: Compare estimated peak-hour beverage demand with dispenser throughput before selecting equipment. This planning model assumes one dispensing station can serve approximately 120 standard 12 fl oz servings per hour, based on a 30-second average service cycle.

Quantify Packaging Savings: Replace Repeated Cans and Bottles with Post-Mix Drinks

Why Choose a Soda Machine for Your Business?

Post-mix drinks can reduce the repeated cost of cans and bottles in busy food-service operations. A single syrup container replaces many cases of packaged beverages. Water and carbon dioxide are added on site, so storage needs can shrink. The difference is visible. Fewer cartons may mean less shelf space, fewer deliveries, and lower packaging waste.

A practical cost check should compare the full serving cost. Record the drink volume sold each week, then divide syrup, water, gas, electricity, cleaning, and equipment costs by total servings. Compare that figure with the purchase price of equivalent cans or bottles. For example, if one post-mix serving costs $0.18 and a packaged drink costs $0.48, the potential saving is $0.30 per serving. At 1,000 servings, that equals $300 before maintenance and labor. The calculation is not perfect. Sales volume changes, and syrup waste can reduce the advantage. Track real usage for four weeks before making a decision.

Tips: Measure actual pour sizes, not assumed ones. Check nozzle calibration during busy shifts. Keep a simple log for syrup levels, cleaning time, and service calls. A machine may save packaging costs, but poor maintenance can quietly remove those savings. Also consider customer expectations, peak-hour speed, and available counter space. Small details matter.

Why Choose a Soda Machine for Your Business? – Quantify Packaging Savings: Replace Repeated Cans and Bottles with Post-Mix Drinks
Illustrative operating model for 50,000 servings per month. The comparison uses an equivalent 473 ml serving and includes the primary single-use packaging required for each format.
Evaluation Dimension Cans PET Bottles Post-Mix Drinks Post-Mix Advantage
Equivalent serving size 473 ml 473 ml 473 ml Like-for-like comparison
Monthly servings modeled 50,000 50,000 50,000 Same beverage volume in every scenario
Primary serving container One aluminum can per serving One PET bottle, cap included One lightweight cup, lid and straw Centralized dispensing reduces packaged-product units
Estimated container material per serving 12.0 g aluminum 17.0 g PET and cap 9.0 g cup, lid and straw 3.0 g less than cans; 8.0 g less than PET bottles
Allocated syrup-package material per serving Included in finished product packaging Included in finished product packaging Approximately 0.9 g from bag-in-box packaging Bulk concentrate replaces thousands of individual containers
Total packaging material per serving 12.0 g 17.0 g 9.9 g 17.5% lower than cans; 41.8% lower than PET bottles
Monthly packaging material 600 kg 850 kg 495 kg 105 kg saved versus cans; 355 kg saved versus PET bottles
Annual packaging material 7,200 kg 10,200 kg 5,940 kg 1,260 kg saved versus cans; 4,260 kg saved versus PET bottles
Estimated packaging and container cost per serving $0.075 $0.085 $0.045 $0.030–$0.040 lower per serving
Estimated monthly packaging cost $3,750 $4,250 $2,250 $1,500 saved versus cans; $2,000 saved versus PET bottles
Estimated annual packaging cost $45,000 $51,000 $27,000 $18,000 saved versus cans; $24,000 saved versus PET bottles
Individual packages handled per 50,000 servings 50,000 cans 50,000 bottles Approximately 400 concentrate containers plus serving cups Fewer finished beverage containers to receive, store and dispose of
Storage profile Large volume of prefilled, rigid containers Large volume of prefilled, rigid containers Concentrate cartons plus cups and dispensing supplies More efficient use of back-room and refrigerated storage
Waste-reduction potential Limited; every serving creates a complete can Limited; every serving creates a complete bottle and cap High; beverage is mixed when dispensed and concentrate is delivered in bulk Less rigid packaging per serving and fewer empty containers
Break-even packaging savings at 50,000 servings/month Baseline Baseline Before equipment, cleaning and utilities Monthly packaging savings can offset operating costs over time
Calculation assumptions: 50,000 servings per month; 473 ml per serving; 12.0 g aluminum can; 17.0 g PET bottle and cap; 9.0 g cup, lid and straw; 0.9 g allocated bag-in-box concentrate packaging per serving; container and packaging costs are planning estimates based on typical foodservice purchasing ranges and should be replaced with local supplier quotations.
Important: Actual savings vary according to serving size, cup specification, recycling rates, concentrate dilution ratio, equipment costs, cleaning requirements, labor, utilities and local packaging prices. The table measures packaging-related savings only and does not represent a guaranteed financial return.

Verify Compliance: Follow FDA Food Code Standards for Water, Ice, and CO₂

Why Choose a Soda Machine for Your Business?

A soda machine can improve service speed, but compliance must guide every installation. The FDA Food Code 2022 treats ice as food and requires safe handling. It also requires water to come from an approved, protected source. These details matter because the CDC estimates that foodborne illness causes about 48 million illnesses annually in the United States. A contaminated line or ice bin can create a serious operational problem.

Start with the water supply. Use a potable connection, suitable backflow protection, and documented filter maintenance. Check the nozzle daily. A clean-looking nozzle can still hide residue inside its diffuser. Ice should be made from drinking water and handled with a dedicated scoop, never bare hands. Keep the scoop outside the ice, in a clean holder. Small shortcuts happen during busy shifts. They still deserve correction.

CO₂ needs equal attention. Select food-grade carbon dioxide and request current supplier documentation, including a certificate of analysis when available. Under 21 CFR 173.350, carbon dioxide is permitted for food use under specified conditions. Store cylinders upright, secured, and away from heat. Inspect regulators, seals, and tubing for leaks. Record pressure checks and sanitation dates. These records support the FDA Food Code approach to equipment maintenance and employee accountability. The weak point is often documentation. If nobody can verify the last filter change, the procedure needs improvement.

FAQS

What gross margin can a fountain soda machine potentially deliver?

It may deliver 60–80% gross margins when drink volume stays steady. However, this is not net profit.

What costs should be included in each serving?

Count syrup, carbonated water, ice, cups, lids, straws, and expected waste. Include cleaning and payment fees.

How can serving size affect beverage profits?

Oversized ice portions can reduce syrup yield and increase the cost of each drink. Small errors add up.

Why might an estimate look better than reality?

Some estimates ignore cleaning time, product loss, maintenance, or equipment payments. That mistake is easy.

When does a larger machine make financial sense?

A busy lunch counter may support a larger machine through frequent drink sales. A quiet café may not.

How can post-mix drinks reduce packaging costs?

One syrup container can replace many cans or bottles. Fewer cartons may reduce storage and deliveries.

What is an example of potential savings per serving?

If a post-mix drink costs $0.18 and a packaged drink costs $0.48, savings may reach $0.30. At 1,000 servings, that equals $300 before other costs.

How long should sales and usage be tracked?

Track servings, pour sizes, syrup levels, cleaning time, and service calls for four weeks. Review the records monthly.

Conclusion

Choosing a Soda Machine can be a practical way for a business to improve beverage service, control costs, and increase profitability. Fountain drinks often offer gross margins of approximately 60–80%, making them an attractive addition to restaurants, cafés, convenience stores, and other high-volume operations. By applying the common 5:1 water-to-syrup ratio, operators can estimate the cost per serving, monitor ingredient usage, and set prices with greater accuracy.

A Soda Machine can also reduce packaging expenses by replacing repeated purchases of cans and bottles with post-mix beverages. Before installation, businesses should compare dispenser throughput with peak-hour demand to ensure customers are served quickly and consistently. Careful planning should also include compliance with applicable food safety standards for water quality, ice handling, equipment sanitation, and carbon dioxide storage. With proper maintenance and capacity planning, a fountain system can support efficient service while reducing waste and strengthening overall business performance.

Aria

Aria

Aria is a dedicated marketing professional with a deep passion for innovative strategies and a keen understanding of our company's product offerings. With a wealth of experience in the industry, Aria excels at crafting engaging content that highlights the unique features and benefits of our......